2017年7月28日有新的补充,见补充分割线之后!
========================================================
在上一篇《Linux perf子系统的使用(二)——采样(signal方式)》中,我使用了信号来接收采样完成通知,并在回调函数中读取最新的采样值。虽说回调方式有很多优点,但是并不是太通用。更加糟糕的是,信号会打断几乎所有的系统调用,使得本来的程序逻辑被破坏。另一个很糟糕的点是,如果一个进程中需要开多个采样器,那么就要共享同一个事件回调函数,破坏了封装性。
因此,最好有一个阻塞式轮询的办法。嗯,这就是今天要讲的东西——通过poll()函数等待采样完成。
其实poll()轮询的实现比信号的方式简单,只要把perf_event_open()返回的文件描述符当做普通的文件描述符传入poll()就可以了。在创建perf文件描述附时,唯一需要注意的就是需要手动设置wakeup_events的值。wakeup_events决定了多少次采样以后进行一次通知(poll模式下就是让poll返回),一般设置为1。
直接上代码吧,和《Linux perf子系统的使用(二)——采样(signal方式)》中的代码比较一下就一目了然了。
perf_poll.cpp
#include <poll.h>
#include <errno.h>
#include <stdio.h>
#include <stdint.h>
#include <assert.h>
#include <signal.h>
#include <string.h>
#include <unistd.h>
#include <signal.h>
#include <sys/mman.h>
#include <sys/ioctl.h>
#include <sys/syscall.h>
#include <linux/perf_event.h>

// the number of pages to hold ring buffer
#define RING_BUFFER_PAGES 8

// a wrapper for perf_event_open()
static int perf_event_open(struct perf_event_attr *attr,
    pid_t pid,int cpu,int group_fd,unsigned long flags)
{
    return syscall(__NR_perf_event_open,attr,pid,cpu,group_fd,flags);
}

static bool sg_running=true;

// to receive SIGINT to stop sampling and exit
static void on_closing(int signum)
{
    sg_running=false;
}

int main()
{
    // 这里我强行指定了一个值
    pid_t pid=6268;
    // create a perf fd
    struct perf_event_attr attr;
    memset(&attr,0,sizeof(struct perf_event_attr));
    attr.size=sizeof(struct perf_event_attr);
    // disable at init time
    attr.disabled=1;
    // set what is the event
    attr.type=PERF_TYPE_SOFTWARE;
    attr.config=PERF_COUNT_SW_CPU_CLOCK;
    // how many clocks to trigger sampling
    attr.sample_period=1000000;
    // what to sample is IP
    attr.sample_type=PERF_SAMPLE_IP;
    // notify every 1 overflow
    attr.wakeup_events=1;
    // open perf fd
    int perf_fd=perf_event_open(&attr,pid,-1,-1,0);
    if(perf_fd<0)
    {
        perror("perf_event_open() failed!");
        return errno;
    }
    // create a shared memory to read samples from kernel
    void* shared_mem=mmap(0,(1+RING_BUFFER_PAGES)*4096,PROT_READ,MAP_SHARED,perf_fd,0);
    if(shared_mem==0)
    {
        perror("mmap() failed!");
        return errno;
    }
    // reset and enable
    ioctl(perf_fd,PERF_EVENT_IOC_RESET,0);
    ioctl(perf_fd,PERF_EVENT_IOC_ENABLE,0);
    // the offset from the head of ring-buffer where the next sample is
    uint64_t next_offset=0;
    // poll perf_fd
    struct pollfd perf_poll;
    perf_poll.fd=perf_fd;
    perf_poll.events=POLLIN;
    signal(SIGINT,on_closing);
    while(sg_running)
    {
        if(poll(&perf_poll,1,-1)<0)
        {
            perror("poll() failed!");
            break;
        }
        // the pointer to the completed sample
        struct sample
        {
            struct perf_event_header header;
            uint64_t ip;
        }*
        sample=(struct sample*)((uint8_t*)shared_mem+4096+next_offset);
        // the pointer to the info structure of ring-buffer
        struct perf_event_mmap_page* info=(struct perf_event_mmap_page*)shared_mem;
        // update the offset, wrap the offset
        next_offset=info->data_head%(RING_BUFFER_PAGES*4096);
        // allow only the PERF_RECORD_SAMPLE
        if(sample->header.type!=PERF_RECORD_SAMPLE)
            continue;
        printf("%lx\n",sample->ip);
    }
    printf("clean up\n");
    // disable
    ioctl(perf_fd,PERF_EVENT_IOC_DISABLE,0);
    // unmap shared memory
    munmap(shared_mem,(1+RING_BUFFER_PAGES)*4096);
    // close perf fd
    close(perf_fd);
    return 0;
}
可以看到除了获取通知的部分由signal改为poll()以外,几乎没有改动。
g++ perf_poll.cpp -o perf_poll
sudo ./perf_poll
====================2017年7月28日补充==================
首先,为了方便以后的使用,我把perf采样callchain的功能封装成了一个C++的类,它能够针对一个特定的pid进行采样,支持带有超时的轮询。接口声明如下:
CallChainSampler.h
#ifndef CALLCHAINSAMPLER_H
#define CALLCHAINSAMPLER_H

#include <stdint.h>
#include <unistd.h>

// a class to sample the callchain of a process
class CallChainSampler
{

public:

    // the structure of a sampled callchain
    struct callchain
    {
        // the timestamp when sampling
        uint64_t time;
        // the pid and tid
        uint32_t pid,tid;
        // the depth of callchain, or called the length
        uint64_t depth;
        // <depth>-array, each items is an IP register value
        const uint64_t* ips;
    };

    // constructor
    //  pid: the process's id
    //  period: how many clocks to trigger a sample
    //  pages: how many pages (4K) allocated for the ring-buffer to hold samples
    CallChainSampler(pid_t pid,uint64_t period,uint32_t pages);

    // destructor
    ~CallChainSampler();

    // start sampling
    void start();

    // stop sampling
    void stop();

    // wait and get the next sample
    //  timeout: the max milliseconds that will block
    //  max_depth: the max depth of the call chain
    //  callchain: the sampled callchain to be outputed
    //  return: if get before timeout, return 0,
    //          if timeout, return -1
    //          if an error occurs, return errno
    //  ATTENTION: the field [ips] in callchain should be used immediately,
    //             don't hold it for too long time
    int sample(int32_t timeout,uint64_t max_depth,struct callchain* callchain);

private:

    // the perf file descriptor
    int fd;
    // the mmap area
    void* mem;
    // how many pages to hold the ring-buffer
    uint32_t pages;
    // the offset in the ring-buffer where the next sample is
    uint64_t offset;

};

#endif
实现基本就是把上面的C代码封装一下:
CallChainSampler.cpp
#include "CallChainSampler.h"

#include <poll.h>
#include <errno.h>
#include <assert.h>
#include <string.h>
#include <stdexcept>
#include <sys/time.h>
#include <sys/mman.h>
#include <sys/ioctl.h>
#include <sys/syscall.h>
#include <linux/perf_event.h>

// a wrapper for perf_event_open()
static int perf_event_open(struct perf_event_attr *attr,
    pid_t pid,int cpu,int group_fd,unsigned long flags)
{
    return syscall(__NR_perf_event_open,attr,pid,cpu,group_fd,flags);
}

// a tool function to get the time in ms
static uint64_t get_milliseconds()
{
    struct timeval now;
    assert(gettimeofday(&now,0)==0);
    return now.tv_sec*1000+now.tv_usec/1000;
}

#define min(a,b) ((a)<(b)?(a):(b))

CallChainSampler::CallChainSampler(pid_t pid,uint64_t period,uint32_t pages)
{
    // create a perf fd
    struct perf_event_attr attr;
    memset(&attr,0,sizeof(struct perf_event_attr));
    attr.size=sizeof(struct perf_event_attr);
    // disable at init time
    attr.disabled=1;
    // set what is the event
    attr.type=PERF_TYPE_SOFTWARE;
    attr.config=PERF_COUNT_SW_CPU_CLOCK;
    // how many clocks to trigger sampling
    attr.sample_period=period;
    // what to sample is IP
    attr.sample_type=PERF_SAMPLE_TIME|PERF_SAMPLE_TID|PERF_SAMPLE_CALLCHAIN;
    // notify every 1 overflow
    attr.wakeup_events=1;
    // open perf fd
    fd=perf_event_open(&attr,pid,-1,-1,0);
    if(fd<0)
        throw std::runtime_error("perf_event_open() failed!");
    // create a shared memory to read samples from kernel
    mem=mmap(0,(1+pages)*4096,PROT_READ,MAP_SHARED,fd,0);
    if(mem==0)
        throw std::runtime_error("mmap() failed!");
    this->pages=pages;
    // the offset of next sample
    offset=0;
}

CallChainSampler::~CallChainSampler()
{
    stop();
    // unmap shared memory
    munmap(mem,(1+pages)*4096);
    // close perf fd
    close(fd);
}

void CallChainSampler::start()
{
    // enable
    ioctl(fd,PERF_EVENT_IOC_ENABLE,0);
}

void CallChainSampler::stop()
{
    // disable
    ioctl(fd,PERF_EVENT_IOC_DISABLE,0);
}

int CallChainSampler::sample(int32_t timeout,uint64_t max_depth,struct callchain* callchain)
{
    if(callchain==0)
        throw std::runtime_error("arg <callchain> is NULL!");
    // the poll sturct
    struct pollfd pfd;
    pfd.fd=fd;
    pfd.events=POLLIN;
    // the time when start
    uint64_t start=get_milliseconds();
    while(1)
    {
        // the current time
        uint64_t now=get_milliseconds();
        // the milliseconds to wait
        int32_t to_wait;
        if(timeout<0)
            to_wait=-1;
        else
        {
            to_wait=timeout-(int32_t)(now-start);
            if(to_wait<0)
                return -1;
        }
        // wait next sample
        int ret=poll(&pfd,1,to_wait);
        if(ret==0)
            return -1;
        else if(ret==-1)
            return errno;
        // the pointer to the completed sample
        struct sample
        {
            struct perf_event_header header;
            uint32_t pid,tid;
            uint64_t time;
            uint64_t nr;
            uint64_t ips[0];
        }*
        sample=(struct sample*)((uint8_t*)mem+4096+offset);
        // the pointer to the info structure of ring-buffer
        struct perf_event_mmap_page* info=(struct perf_event_mmap_page*)mem;
        // update the offset, wrap the offset
        offset=info->data_head%(pages*4096);
        // allow only the PERF_RECORD_SAMPLE
        if(sample->header.type!=PERF_RECORD_SAMPLE)
            continue;
        // fill the result
        callchain->time=sample->time;
        callchain->pid=sample->pid;
        callchain->tid=sample->tid;
        callchain->depth=min(max_depth,sample->nr);
        callchain->ips=sample->ips;
        return 0;
    }
}
最后要补充一个我最新的发现!perf_event_open()里面传入的pid,本质上是一个线程id,也就是tid。它只能监控一个线程,而无法监控一个进程中的所有线程。所以要用到实际项目中,肯定得配合使用epoll来监控所有的线程。
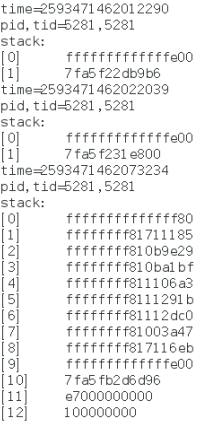
测试代码如下:
#include <stdio.h>
#include <signal.h>
#include <stdlib.h>

#include "CallChainSampler.h"

CallChainSampler* sampler;

// to receive SIGINT to stop sampling and exit
static void on_closing(int signum)
{
    delete sampler;
    exit(0);
}

int main()
{
    // create a sampler, pid=5281, 10000 clocks trigger a sample
    // and allocate 128 pages to hold the ring-buffer
    sampler=new CallChainSampler(5281,10000,128);
    signal(SIGINT,on_closing);
    sampler->start();
    for(int i=0;i<10000;i++)
    {
        CallChainSampler::callchain callchain;
        // sample, max depth of callchain is 256
        int ret=sampler->sample(-1,256,&callchain);
        printf("%d\n",ret);
        if(ret==0)
        {
            // successful sample, print it out
            printf("time=%lu\n",callchain.time);
            printf("pid,tid=%d,%d\n",callchain.pid,callchain.tid);
            printf("stack:\n");
            for(int j=0;j<callchain.depth;j++)
                printf("[%d]   %lx\n",j,callchain.ips[j]);
        }
    }
    return 0;
}